- 教育
- Торговые стратегии
- Parabolic SAR: Отслеживание импульса рыночного тренда
Parabolic SAR: Отслеживание импульса рыночного тренда
Понимание того, когда тренд продолжается или вот-вот развернётся, может существенно повлиять на результаты торговли. Parabolic SAR (Stop and Reverse) — это простой инструмент, который визуально показывает направление тренда и потенциальные точки входа и выхода. В отличие от других индикаторов, он «следует» за ценой как тень, отображая рыночный импульс в реальном времени.
- Что такое Parabolic SAR?
- Почему трейдеры доверяют ему в трендовых рынках
- Как использовать Parabolic SAR в торговле
- Ограничения SAR
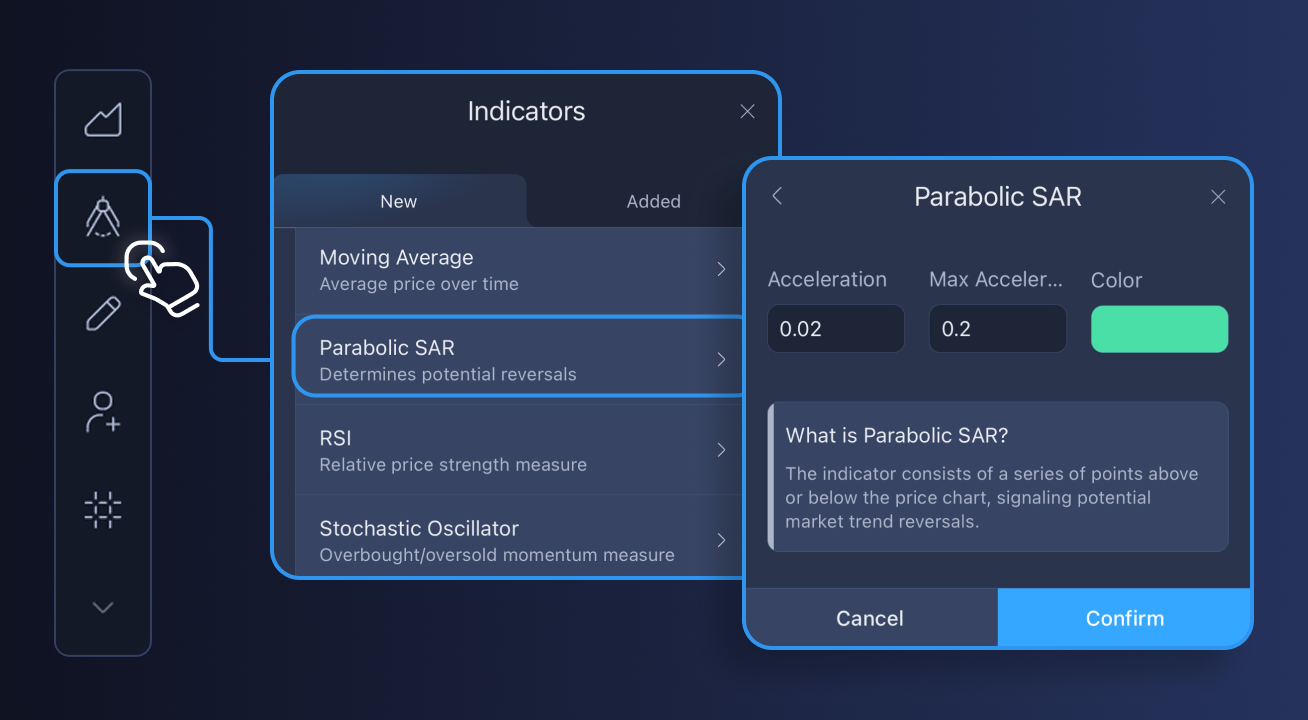
Что такое Parabolic SAR?
Parabolic SAR, разработанный J. Welles Wilder, предназначен для отслеживания ценового импульса и выявления потенциальных точек разворота. На графике он отображается в виде последовательности точек, следующих за движением цены — как следы, показывающие направление рынка.
- Точки ниже цены: восходящий тренд — бычий импульс
- Точки выше цены: нисходящий тренд — медвежий импульс
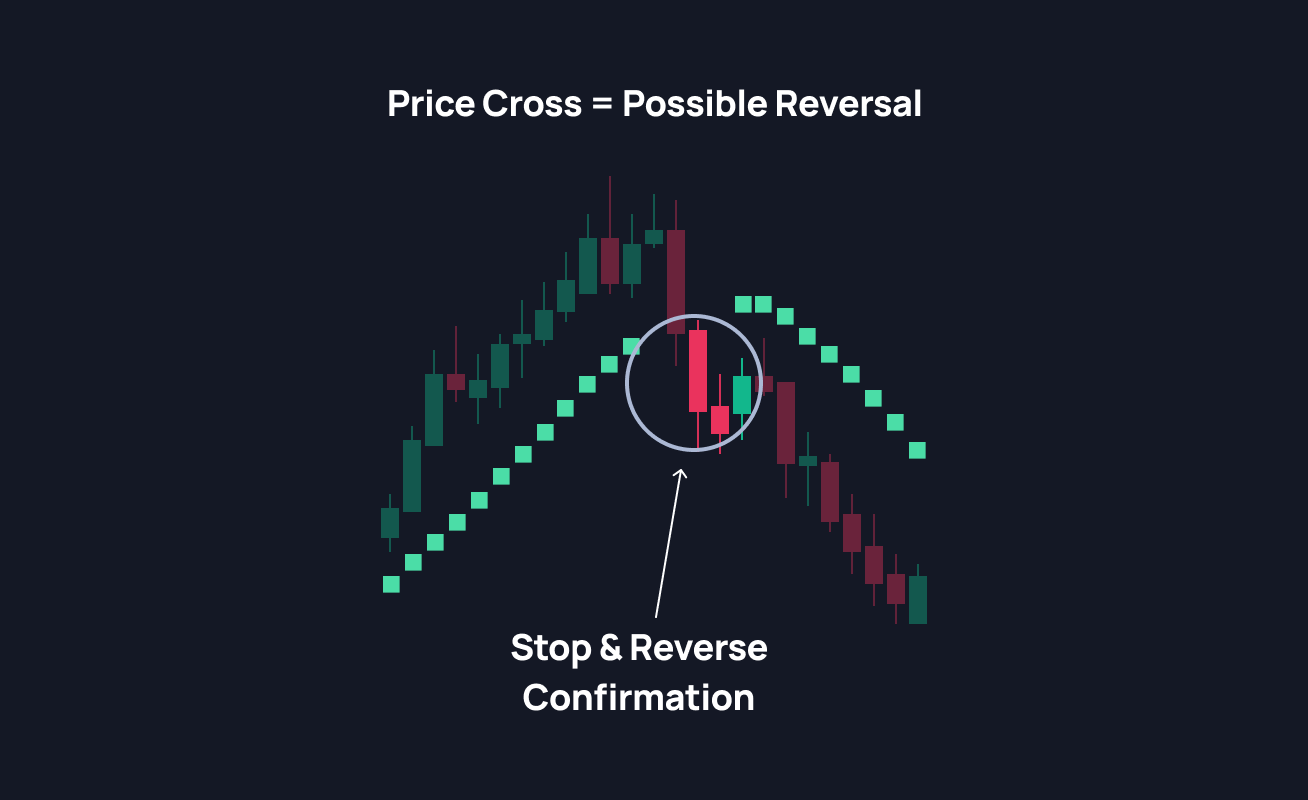
- Прорыв цены через точки: возможный разворот или пауза тренда
Он прост, нагляден и эффективен — особенно в трендовых стратегиях.
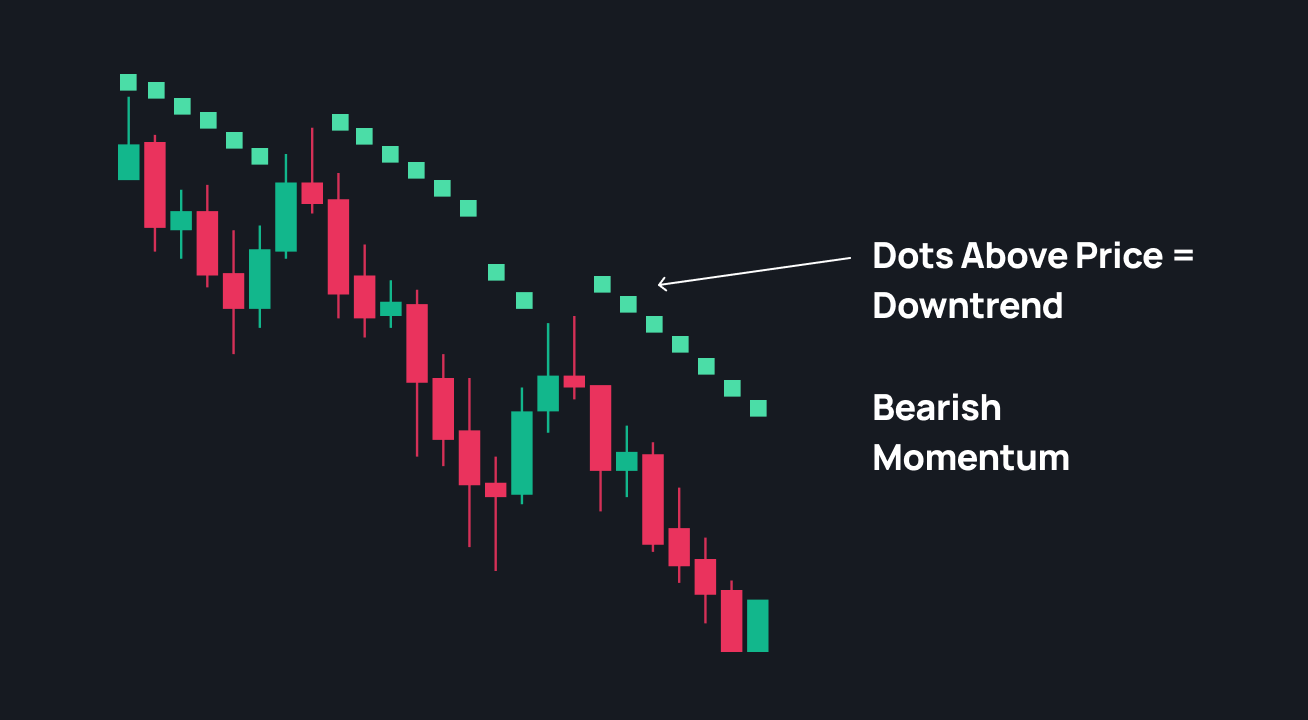
Почему трейдеры доверяют ему в трендовых рынках
Parabolic SAR лучше всего работает, когда рынок имеет чёткое направление:
- В восходящем тренде цена обычно держится выше точек, помогая удерживать длинные позиции
- В нисходящем тренде цена остаётся ниже точек, помогая находить короткие возможности
Поскольку SAR динамически адаптируется к движению цены, он работает как встроенный трейлинг-стоп, помогая фиксировать прибыль по мере продолжения тренда.
Совет: не используйте SAR в боковом рынке отдельно — ложные сигналы встречаются чаще. Лучше комбинировать его с трендовыми или импульсными индикаторами.
Как использовать Parabolic SAR в торговле
Трейдеры обычно используют SAR тремя способами:
1. Следование за трендом
- Call, когда точки переходят ниже цены
- Put, когда точки переходят выше цены
Этот простой визуальный сигнал помогает торговать по импульсу, а не против него.
2. Определение разворота
Когда цена пересекает точки SAR, это может указывать на смену тренда. Трейдеры используют это как сигнал для закрытия позиции и смены направления.
3. Установка трейлинг-стопа
Точки SAR автоматически следуют за ценой — это удобно для установки стоп-лосса. Это помогает защищать прибыль и удерживать выгодные сделки дольше.
Ограничения SAR
Как и любой индикатор, Parabolic SAR имеет свои ограничения:
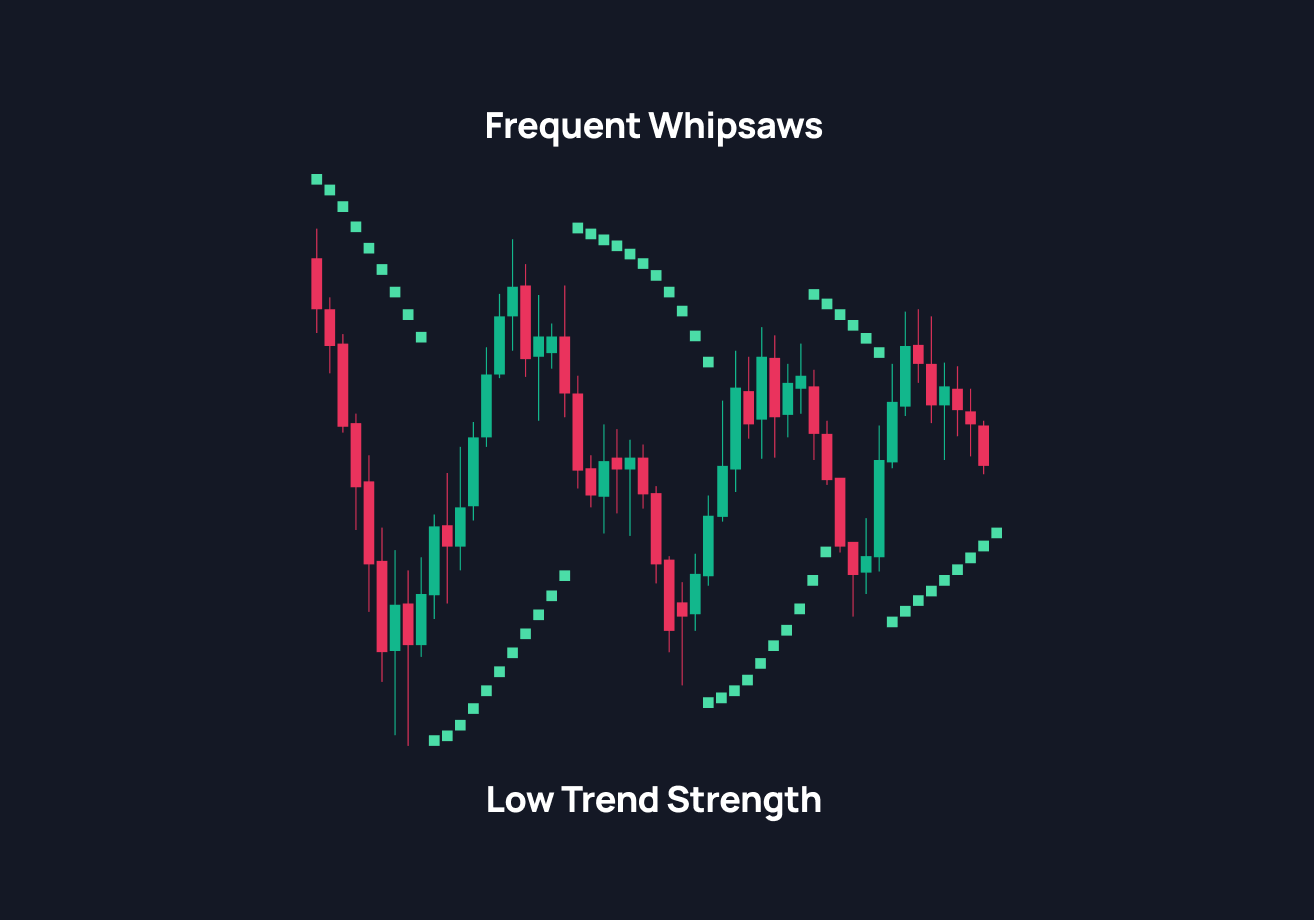
- Задержка в волатильных рынках: частые развороты создают шум
- Не подходит как самостоятельный инструмент: лучше работает с трендовыми и импульсными индикаторами
- Менее надёжен в консолидации: возможны ложные сигналы при узком диапазоне движения
Поэтому большинство трейдеров используют SAR как вспомогательный индикатор, а не как единственный инструмент принятия решений.
Чтобы усилить анализ, Parabolic SAR часто комбинируют с:
- Moving Averages: подтверждение общего направления тренда
- RSI (Relative Strength Index): определение перекупленности и перепроданности
- MACD: подтверждение изменений импульса и возможных разворотов
Parabolic SAR — это простой, но мощный инструмент для управления сделками в трендовых рынках. Он показывает, когда оставаться в позиции, когда выходить и когда может меняться импульс.
Попробуйте протестировать SAR на графиках, поэкспериментируйте с разными таймфреймами и комбинируйте его с другими трендовыми или импульсными индикаторами. Чем раньше вы определяете разворот и увереннее следуете за трендом, тем сильнее становится ваша торговая дисциплина.